
Grafana is an open-source lightweight dashboard tool. It can be integrated with many data sources like Prometheus, AWS cloud watch, Stackdriver, etc.
This tutorial explains the Grafana setup on a Kubernetes cluster. You can create dashboards on Grafana for all the Kubernetes metrics through prometheus.
Lets get started with the setup.
Step 1: Create file named grafana-datasource-config.yaml
|
1
|
vi grafana–datasource–config.yaml
|
Copy the following contents.
Note: The following datasource configuration is for prometheus. If you have more data sources, you can add more data sources with different YAMLs under data section.
|
1
2
3
4
5
6
7
8
9
10
11
12
13
14
15
16
17
18
19
20
21
|
apiVersion: v1
kind: ConfigMap
metadata:
name: grafana–datasources
namespace: monitoring
data:
prometheus.yaml: |–
{
“apiVersion”: 1,
“datasources”: [
{
“access”:“proxy”,
“editable”: true,
“name”: “prometheus”,
“orgId”: 1,
“type”: “prometheus”,
“url”: “http://prometheus-service.monitoring.svc:8080”,
“version”: 1
}
]
}
|
Step 2: Create the configmap using the following command.
|
1
|
kubectl create –f grafana–datasource–config.yaml
|
Step 3: Create a file named deployment.yaml
|
1
|
vi deployment.yaml
|
Copy the following contents
|
1
2
3
4
5
6
7
8
9
10
11
12
13
14
15
16
17
18
19
20
21
22
23
24
25
26
27
28
29
30
31
32
33
34
35
36
37
38
39
40
41
42
|
apiVersion: apps/v1
kind: Deployment
metadata:
name: grafana
namespace: monitoring
spec:
replicas: 1
selector:
matchLabels:
app: grafana
template:
metadata:
name: grafana
labels:
app: grafana
spec:
containers:
– name: grafana
image: grafana/grafana:latest
ports:
– name: grafana
containerPort: 3000
resources:
limits:
memory: “2Gi”
cpu: “1000m”
requests:
memory: “1Gi”
cpu: “500m”
volumeMounts:
– mountPath: /var/lib/grafana
name: grafana–storage
– mountPath: /etc/grafana/provisioning/datasources
name: grafana–datasources
readOnly: false
volumes:
– name: grafana–storage
emptyDir: {}
– name: grafana–datasources
configMap:
defaultMode: 420
name: grafana–datasources
|
Step 4: Create the deployment
|
1
|
kubectl create –f deployment.yaml
|
Step 5: Create a service file named service.yaml
|
1
|
vi service.yaml
|
Copy the following contents. This will expose Grafana on NodePort 32000. You can also expose it using ingress or a Loadbalancer based on your requirement.
|
1
2
3
4
5
6
7
8
9
10
11
12
13
14
15
16
|
apiVersion: v1
kind: Service
metadata:
name: grafana
namespace: monitoring
annotations:
prometheus.io/scrape: ‘true’
prometheus.io/port: ‘3000’
spec:
selector:
app: grafana
type: NodePort
ports:
– port: 3000
targetPort: 3000
nodePort: 32000
|
Step 6: Create the service.
|
1
|
kubectl create –f service.yaml
|
Now you should be able to access the Grafana dashboard using any node IP on port 3200. Use the following default username and password to login. Once you login with default credentials, it will prompt to change the default password.
|
1
2
|
User: admin
Pass: admin
|
Setup Kubernetes Dashbaords
There are many prebuilt Grafana templates available for various data sources. You can check out the templates from here.
Setting up a dashboard from a template is pretty easy. Follow the steps given below to setup a dashboard to monitor kubernetes deployments.
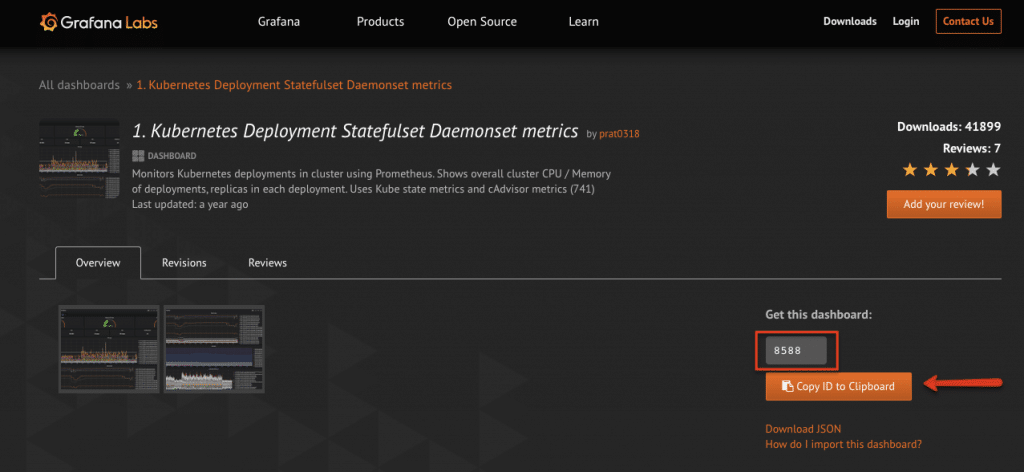
Step 1: Get the template ID from grafana public template. as shown below.
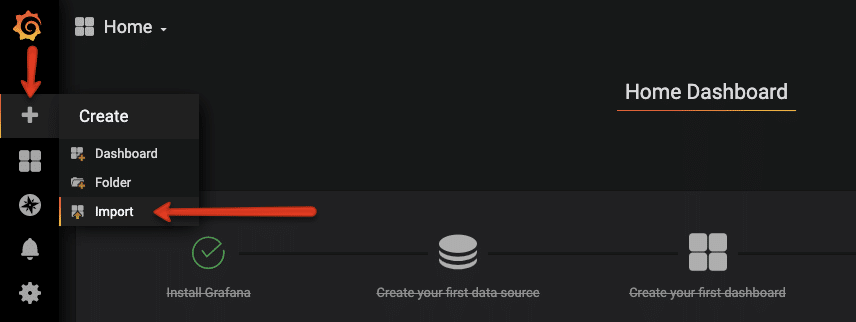
Step 2: Head over to grafana and select the import option.
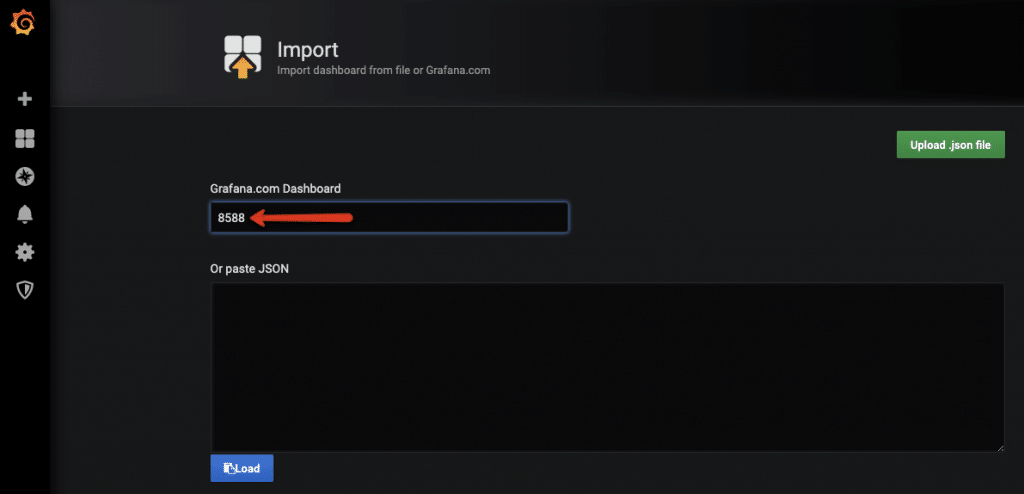
Step 3: Enter the dashboard ID you got it step 1
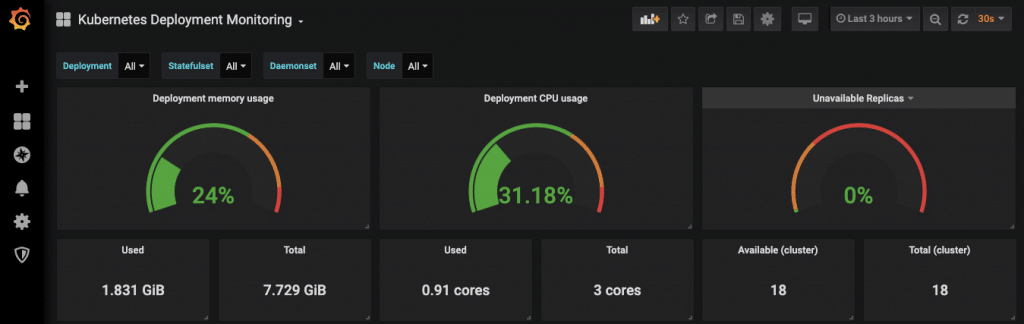
Step 4: Grafana will automatically fetch the template from Grafana website. You can change the values as shown in the image below and click import.
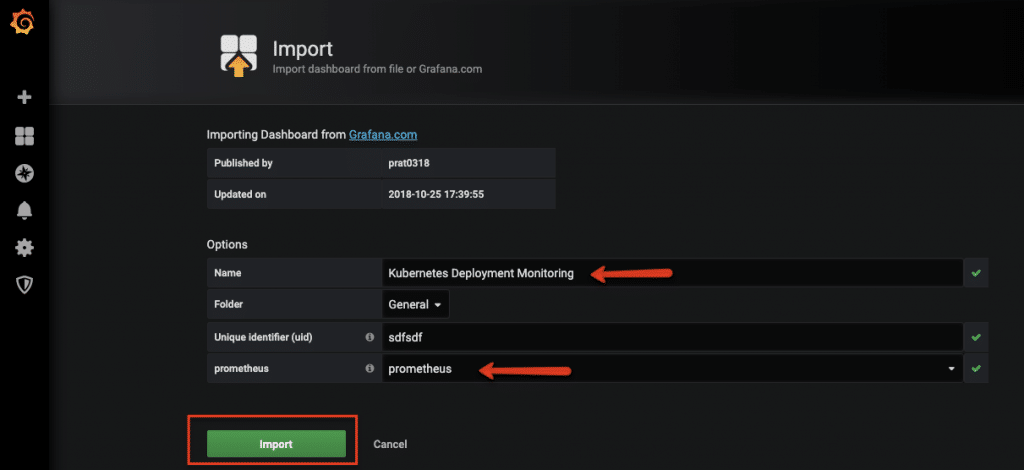
You should see the dashboard immediately.
Conclusion
Grafana is a very powerful tool when it comes to dashboards. It is used by many organisations to monitor their workloads.


